Trend Chart Operations
You can view trend charts through right-clicking data connection element and graphic element with dynamic effect configured.
Trend Chart Description
- X axis: Time.
- Y axis: Value.
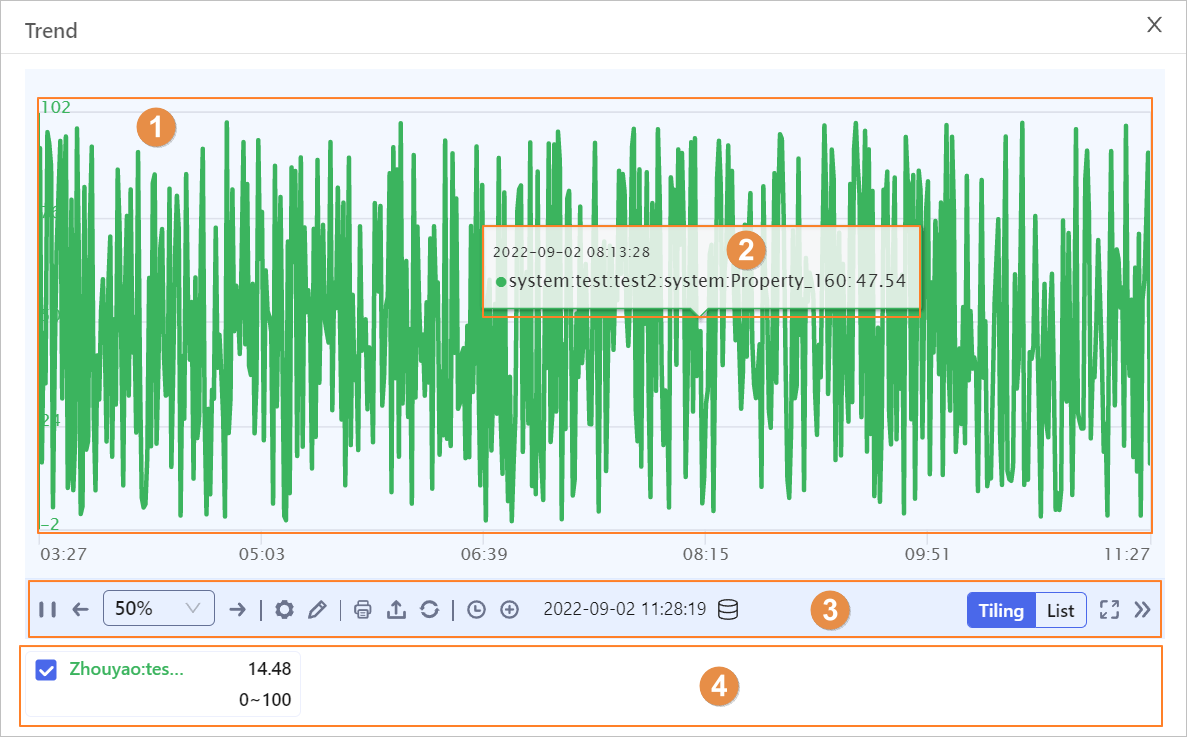
| No. | Section | Description |
|---|---|---|
| 1 | Trend line | Displays data change trend of the current tag. You can view more tag trends by dragging elements bound with corresponding tags to the trend chart. info Different tags are displayed through lines in different color. |
| 2 | Data details | Point to a data point on the trend line, corresponding data details are displayed. |
| 3 | Tool bar | Offers various tools to operate on the trend chart. |
| 4 | Tag | Displays data information of a tag.
|
Tool Bar Description

| Icon | Description |
|---|---|
  | Start or pause the trend chart to view the trend line in a certain period of time. |
 | Adjust the percentage and click arrows to move the trend line forward or backward based on the set value. For example, set the value to 50%, click the right arrow and the trend line moves forward half of the visible field. |
 | Trend chart settings. |
 | Brush settings. |
 | Print the current trend chart. |
 | Export history data of the tag to a .csv file. |
 | Refresh the trend chart. |
 | Set a time period to view the trend line in the set period. Click to switch back to real-time trend. |
 | Set a time interval to view the trend line at the set interval. For example, set it to 8 hours, then the visible field of the trend chart displays trend line in the last 8 hours. Click to switch back to real-time trend. |
 | Displays the current date and time. It is also the end point of the real-time trend line. |
 | Click to view all data sources that are bound with a data connection element or a graphic element with dynamic effect configured on the current page. You can select data sources to view corresponding trend lines. |
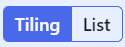 | Select to display property data of the added tags in tiles or list. |
 | Cascading mode. |
 | Hide/display the tool bar. |
Trend Chart Configuration
Trend Chart Settings
Click to set the trend chart.
- Trend Layout: Select information that shows on the trend chart.


- Numerical Coordinate Settings: Set the display range, font color and interval of Y axis.
- Enable Single Y Axis, and then values of all data sources are displayed on one Y axis. Otherwise, each data source has corresponding Y axis.
- Enable Range Adaptation, and values on Y axis of each data source is self-adaptive and independent from each other. Disable it and then you can set ranges for Y axis of each data source.
- Set the value display type, value font color, decimal and value display interval of Y axis.

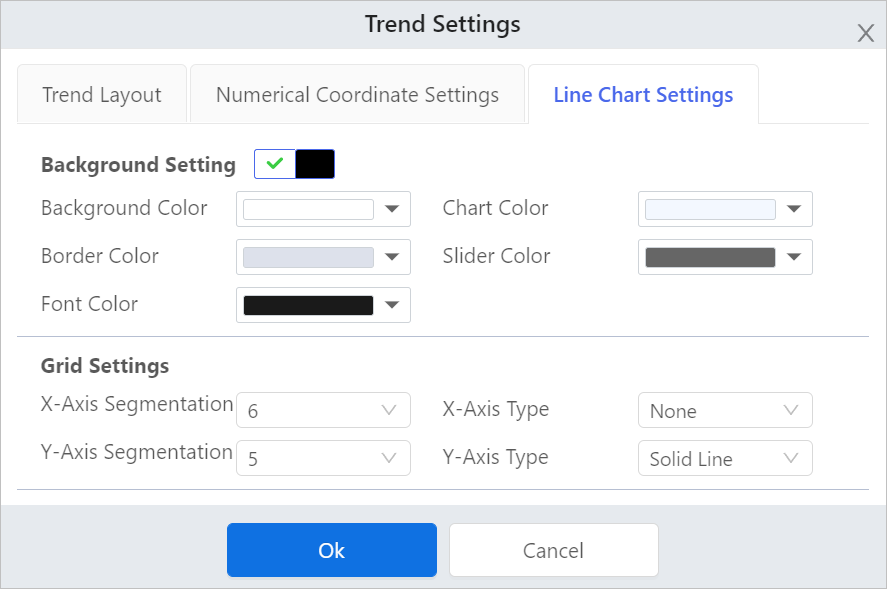
- Line Chart Settings: Set the trend chart styles.
- Background Setting: Click
 to switch the trend chart between dark and light mode. You can set colors of the background, chart, border, slider and font.
 - Grid Settings: Set the X and Y axis line type and number of segments.

- Background Setting: Click
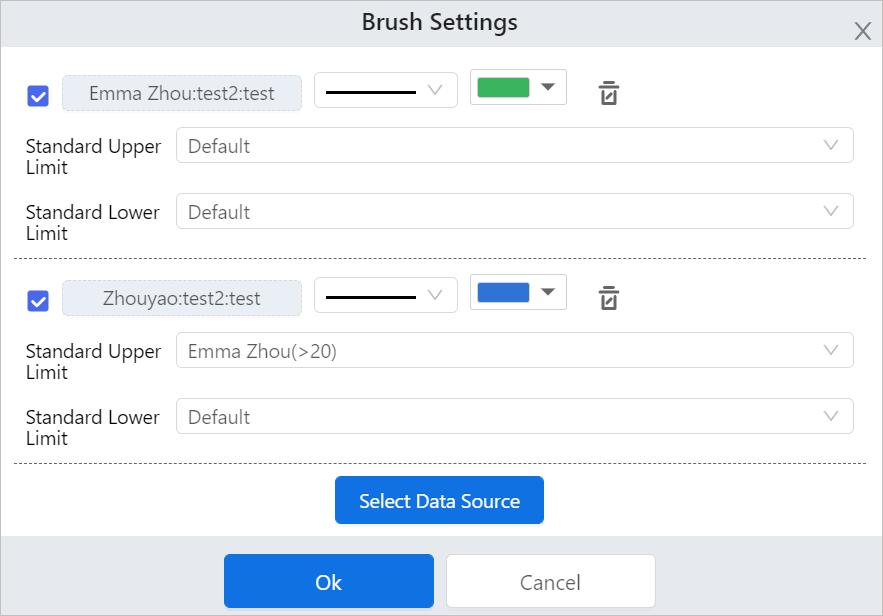
Brush Settings
Click to configure the brush.
- Set the trend line styles of each data sources.
- Based on the set alarm rule of a data source, the data standard range is displayed.info
- When there are multiple alarm rules, the standard upper/lower limit takes the lowest/highest value. You can change them as needed.
- In Cascading Mode, select Exceed Limit and then data exceeds the set upper and lower limits is displayed in red.
- Click Select Data Source to add more data sources. You can add up to eight data sources.
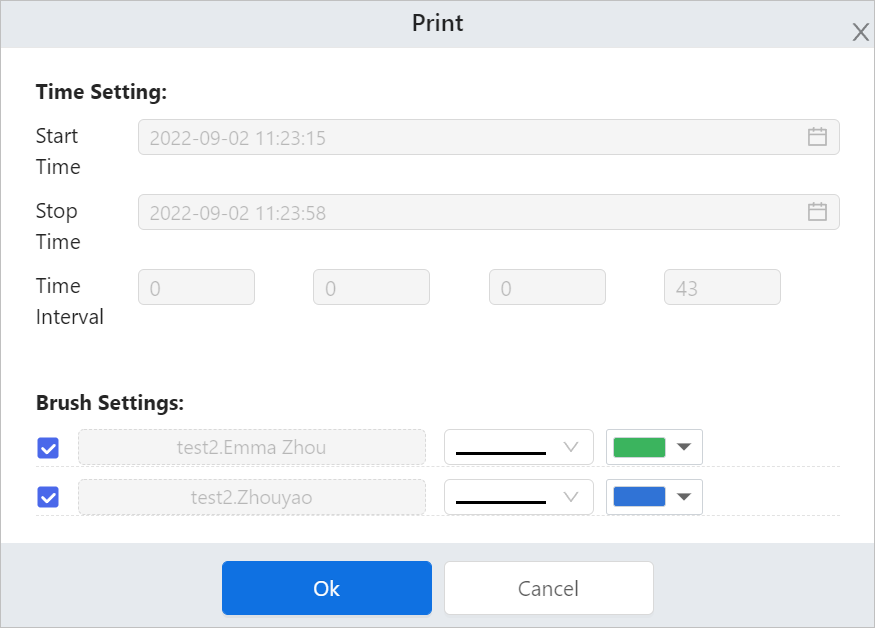
Print Trend Chart
Click to print the trend chart.
Select data sources and set trend line styles of each data source, and then click OK to print the trend chart of the current time period.
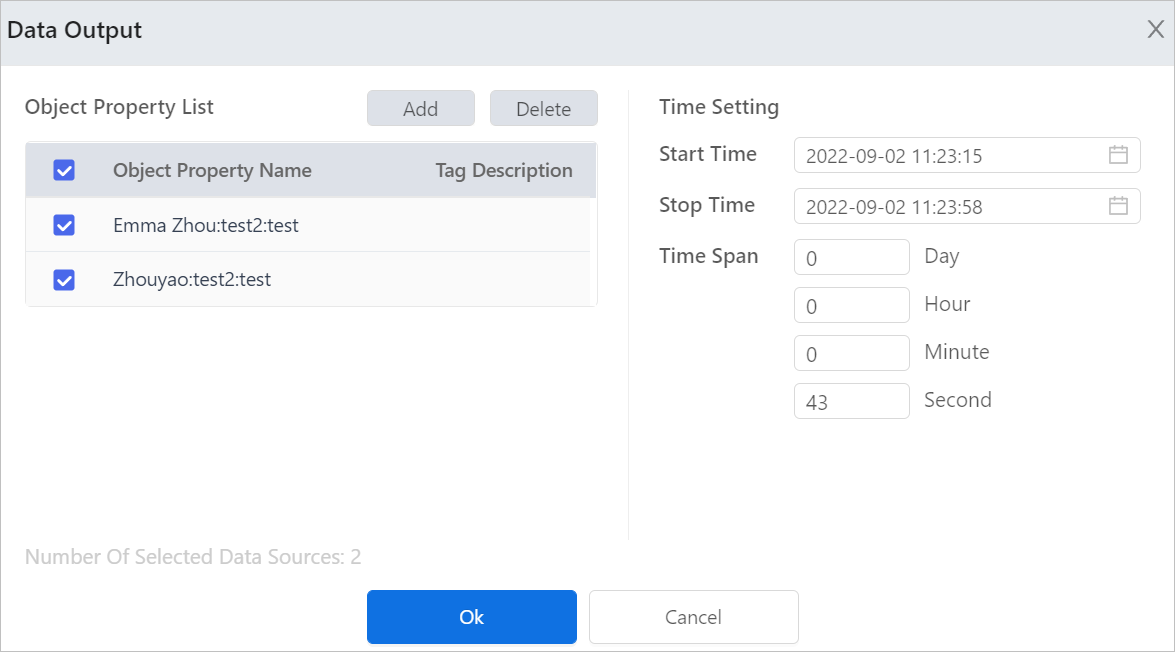
Export Trend Chart
Click to export the trend chart.
- Select data sources, and you can click Add orDelete to add more data or delete existing data.
- Set time period and interval between two pieces of data, and then clickOK to export the trend chart.caution
You can export up to 10,000 pieces of data. When exceeded, the export will fail.
Cascading Mode
Click to display the trend chart in cascading mode with all trend lines separated.
- Exceed Limit: According to the set range in Brush Settings, any data exceeds the range is displayed in red.

- Statistics: Displays the maximum. minimum, average and standard deviation values on the chart.

- Grid Lines: Displays or hides grid lines.